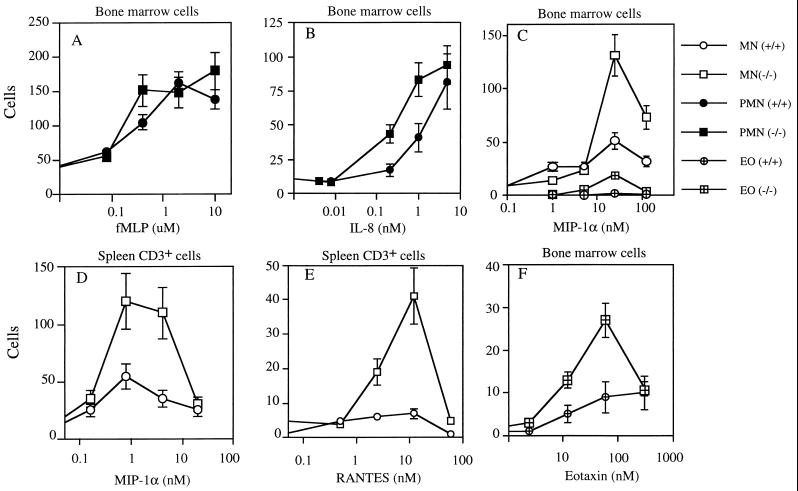
Figure 2.
Chemoattractant-elicited chemotaxis. Bone marrow cells (A, B, C, and F) and CD3+ T cells (D and E) were loaded into individual chambers of a 48-well chemotaxis apparatus. The chamber was incubated at 37°C for 1 hr. Migrating cells adhering to the bottom sides of the membrane separating the chambers were stained with Diff-Quick (Fisher) and counted. The cells in five random fields were counted, noting the differential percentages of mononuclear cells (MN; open symbols), neutrophils (PMN; filled symbols), and eosinophils (EO; crossed symbols). Cells isolated from PLC β2-null mice and from the wild-type mice are represented by squares and circles, respectively. The data are presented as mean ± SEM.

