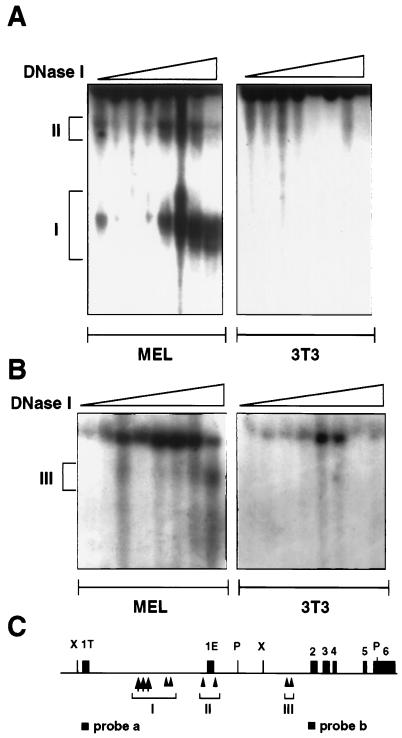
Figure 2.
DNase I HSs within the GATA-1 locus. (A) Map of the mouse GATA-1 locus. HS I, II, and III are indicated by the arrows. The locations of the probes used for mapping are shown. Sites as in Fig. 1. P, PvuII. (B) Nuclei from mouse erythroleukemia cells (MEL) or fibroblasts (3T3) were treated with increasing concentrations of DNase I as indicated by the triangle. Extracted DNA was digested with XbaI. The intact XbaI fragment is at the top of the autoradiogram. HS I and II are indicated by brackets. (C) Identical analysis using a PvuII digest and an exon 2/3 probe. HS III is indicated by the bracket.

