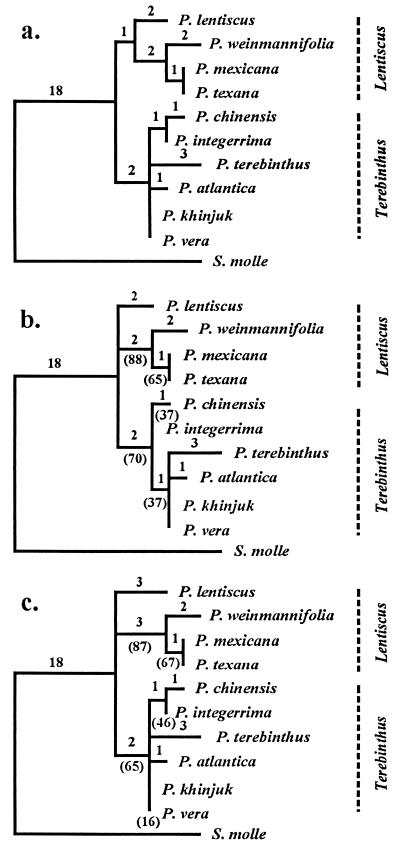
Figure 4.
Phylograms from (a) mixed Dollo parsimony, (b) unordered parsimony and 50% majority rule bootstrap consensus tree from unordered parsimony, and (c) 50% majority rule bootstrap consensus tree from mixed Dollo parsimony analyses of 10 Pistacia species and Schinus molle outgroup. Arm lengths represent relative extent of divergence from nodes with number of mutations/arm. Bootstrap confidence levels are shown in parentheses. Proposed sectional groupings are shown with dotted lines at Right.

