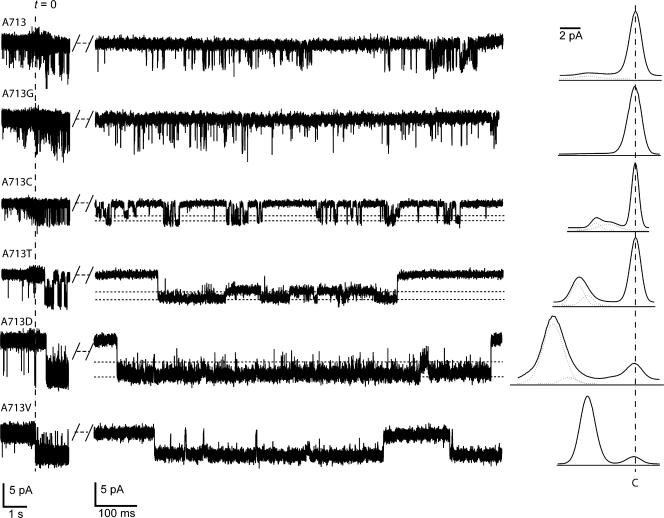
Figure 4.
Single-channel recordings of A713X isoforms at −150 mV. Inward current is down and substates are indicated by a horizontal dashed line. To the left of each trace is a segment of the same recording (displayed on a compressed timescale) showing current in the presence (t < 0) and absence (t > 0) of 50 μM amiloride. All-points histograms are to the right of each trace, including fits to the distribution with a sum of Gaussians. The peak corresponding to the closed state is indicated by the vertical dashed line. Similar results were obtained in at least four patches for each isoform.

