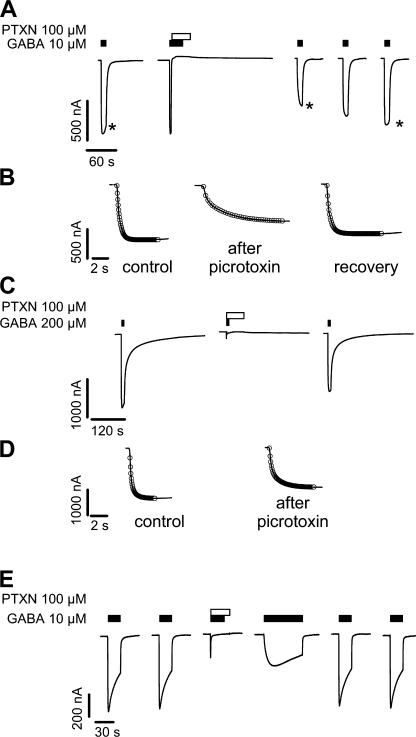
Figure 1.
Picrotoxin bound in the open state was trapped in the channel after channel closure and slows subsequent GABA-induced channel opening. (A) Two electrode voltage clamp recordings from wild-type α1β1γ2S expressing Xenopus oocyte. Black bars above traces indicate 10 μM GABA application; open bar, 100 μM picrotoxin (PTXN) application. In the second trace, the GABA application was begun before the coapplication of GABA and picrotoxin. The stars (*) in A indicate traces shown at expanded time scale in B. Currents during 5-min washes between traces are not shown. (B) Expanded time scale of traces from A, before (control) and after (picrotoxin) application of picrotoxin and after recovery. Exponential fit (open circles) overlays current traces (black line). In some places the black line cannot be seen because the fitted line overlaps the data completely. Note the slowed current rise time after picrotoxin application (picrotoxin) compared with before picrotoxin and after recovery. See text for average time constants. (C) Similar experiment as in A except that a saturating GABA concentration (200 μM) was used. The application of picrotoxin (open bar) is concomitant with the application of GABA. (D) Extended time scale view of the first and third traces in C. Exponential fit (open circles), currents (black lines). (E) After picrotoxin trapping, recovery from picrotoxin-induced inhibition and return of the current to its previous amplitude and opening rate can be accelerated by increasing the duration of GABA application (fourth trace) rather than requiring multiple short GABA applications as in A.

