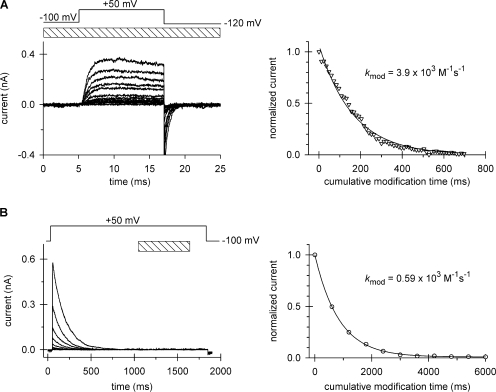
Figure 4.
Modification of cysteine 470 by MTSEA. Patches expressing T449K/I470C channels were repeatedly depolarized from a holding potential of −100 to +50 mV using the pulse protocols shown above the corresponding raw current traces. The timing and the duration (L) of the MTSEA pulse are indicated by the hatched bar. (A) Open-state modification. 12-ms-long depolarizing pulses were applied every 12 s in the presence of 2 mM MTSEA. Perfusion with MTSEA started 200 ms before each depolarizing pulse and the patch was perfused with KF solution for the remaining time at the interpulse holding potential. Every fourth pulse is shown. After 35 pulses, <1% of the original peak current remained. The peak currents for each pulse were normalized to the peak current of the first pulse, corrected, and plotted as a function of the cumulative modification time, as described in Fig. 3 A. (B) Inactivated-state modification. 1.8-ms-long depolarizing pulses were applied every 41.5 s and perfusion with 2 mM MTSEA (L = 600 ms) was initiated 1,000 ms after the start of the depolarization. Peak currents for each pulse were normalized to the peak current of the first pulse and plotted as a function of the cumulative modification time.

