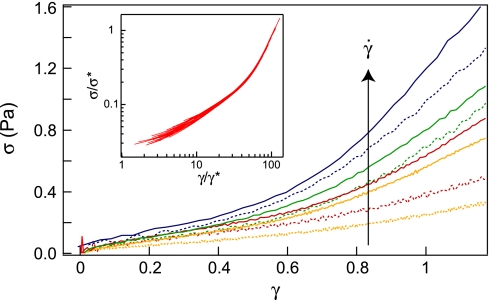
Fig. 3.
Stress–strain curves (γ̇-pulse protocol). The stress σ vs. the strain γ at 21°C (solid lines) and 25°C (dashed lines) for γ̇ [s−1] = 0.05, 0.1, 0.2, 0.4. For all curves L = 21 μm, cA = 9.5 μM. (Inset) Data collapse of 25 stress–strain curves for different T, L, cA, and γ̇ values onto a master relation upon rescaling each curve by its characteristic strain and stress values. The spread of the data at low-strain values is due to instrument limitations causing measurement uncertainties.

