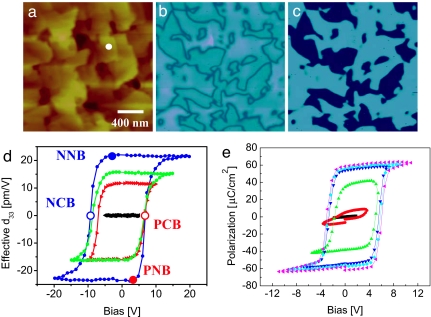
Fig. 1.
Macroscopic and local hysteresis measurements in BiFeO3. (a–c) Surface topography (a), PFM amplitude (b), and phase images (c) of the 200-nm BiFeO3 surface. (d) Local electromechanical hysteresis loops obtained by PFM (at approximate location marked by white dot in a) in comparison with e. (e) P-E hysteresis loops from macroscopic measurements. Both d and e are plotted as a function of voltage applied to the tip (d) or top electrode (e), illustrating close similarity between switching biases. The z-scale in a is 20 nm.

