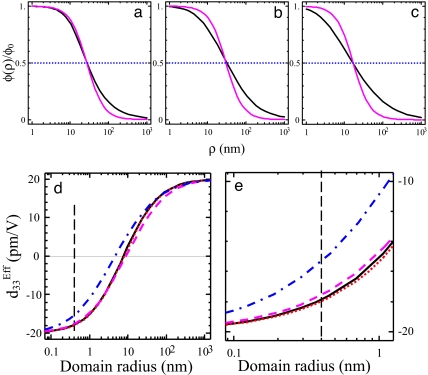
Fig. 3.
Normalized potential distribution dependence on the radial coordinate from the exact series and the Lorentzian expressions (black and violet curves, respectively). Three sets of parameters are used, namely R0 = 15 nm, εe = 81, γ = 27 nm (a); R0 = 50 nm, εe = 10, γ = 30 nm (b); and R0 = 200 nm, εe = 1, γ = 18 nm (c). Dependence of the PFM response on the nascent domain radius calculated for different tip models. (d) The solid curve is the single charge model with d = 14 nm, dotted, dashed, and dash-dotted curves are for the sphere–plane model with R0 = 15, 50, and 200 nm and εe = 81, 10, and 1, respectively. (e) Details at small values of radius.

