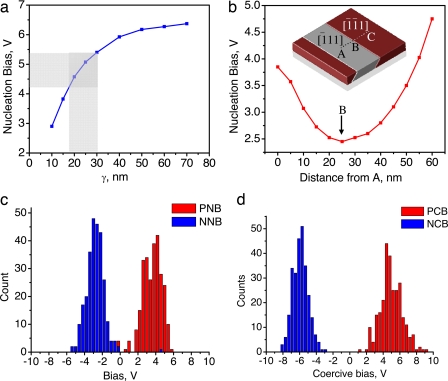
Fig. 4.
Phase-field modeling of polarization switching mechanism in BiFeO3. (a) Variation of nucleation voltage as a function of gamma. (b) Spatial distribution of nucleation potential along the line A–B–C shown by the dotted line in Inset (domain structure under short-circuit boundary conditions). The polarization directions are indicated. (c and d) Histograms of positive and negative nucleation and coercive biases, respectively.

