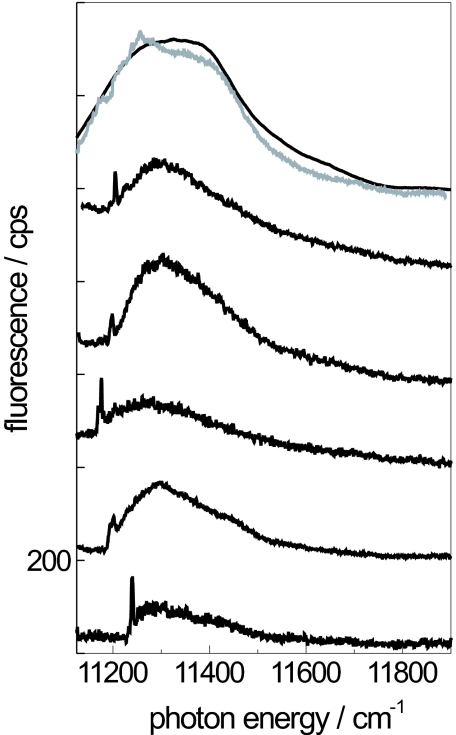
Fig. 2.
Fluorescence–excitation spectra from RC–LH1 complexes from Rps. palustris. The top two traces show the ensemble spectrum (black) and the spectrum that results from summing 41 spectra from individual core complexes (gray). The lower five traces display fluorescence–excitation spectra from individual RC–LH1 complexes. The spectra have been averaged over all polarizations of the incident radiation. The excitation intensity was 10 W/cm2. The vertical scale is given in counted photons per second (cps) and is valid for the lowest trace. The other traces are offset for clarity.

