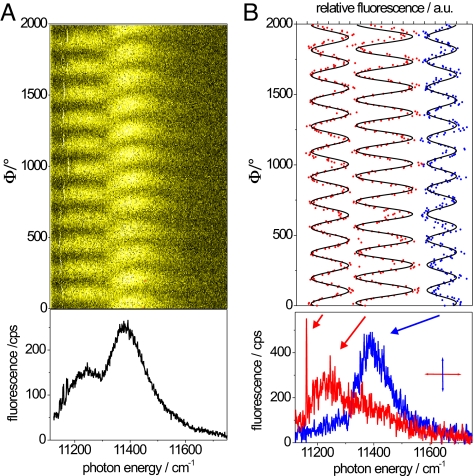
Fig. 3.
Fluorescence–excitation spectrum from an individual RC–LH1 complex from Rps. palustris as a function of the polarization of the excitation light. (A) (Upper) Stack of 312 individual spectra recorded consecutively. Between two successive spectra the polarization of the incident radiation has been rotated by 6.4°. The horizontal axis corresponds to the photon energy, the vertical axis corresponds to the scan number or equivalently to the polarization angle, and the intensity is color-coded. The excitation intensity was 10 W/cm2. (Lower) Spectrum that corresponds to the average of the 312 consecutively recorded spectra. (B) (Upper) Fluorescence intensity of the three bands marked by the arrows in Lower as a function of the polarization of the incident radiation (red dots, blue dots) together with cos2-type functions (black) fitted to the data. (Lower) Two fluorescence–excitation spectra from the stack that correspond to mutually orthogonal polarization of the excitation light. The spectra were chosen such that the “horizontal” polarization yielded maximum intensity for the narrow feature at the low-energy side.

