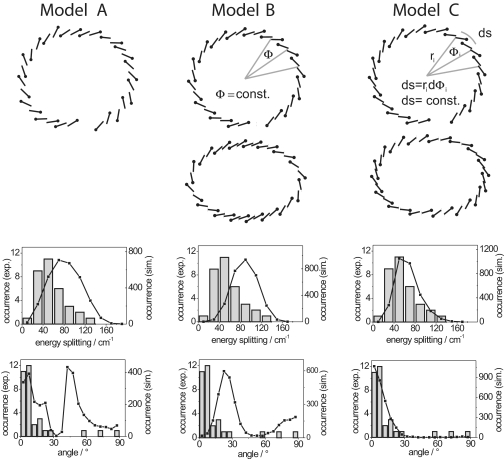
Fig. 4.
Comparison of the energetic separation and the relative orientation of the transition–dipole moments of the k = 1 and k = 2 exciton states from individual RC–LH1 complexes with results from numerical simulations for three different arrangements of the BChl a molecules in the pigment-protein complex. (Top) The model structures A–C that have been used for the numerical simulations. Details are given in the text. Also shown are the model structures B and C on an exaggerated scale to visualize the differences in the pigment arrangement between the two models more clearly. (Middle) Comparison of the experimentally obtained energetic separations between the k = 1 and k = 2 exciton states (gray columns) with numerical simulations (black squares) for the three model structures. (Bottom) Comparison of the experimentally obtained relative orientations of the transition–dipole of the k = 1 and k = 2 exciton states (gray columns) with numerical simulations (black squares) for the three model structures.

