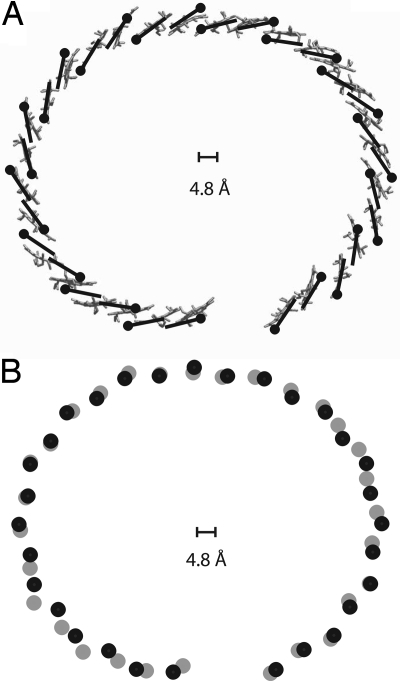
Fig. 5.
Comparison of the x-ray structure (gray) with the structure used for model C (black). (A) Position and orientation of the BChl a molecules of the RC–LH1 complex from Rps. palustris as taken from the protein database (gray) and from model C (black). (B) Position of the central magnesium ions of the BChl a molecules from the protein database (gray dots) and for model C (black dots). The scale bar indicates the resolution of the x-ray structure. The change in the positions of the magnesium ions in the refined structure are well within the limits of accuracy of the x-ray model.

