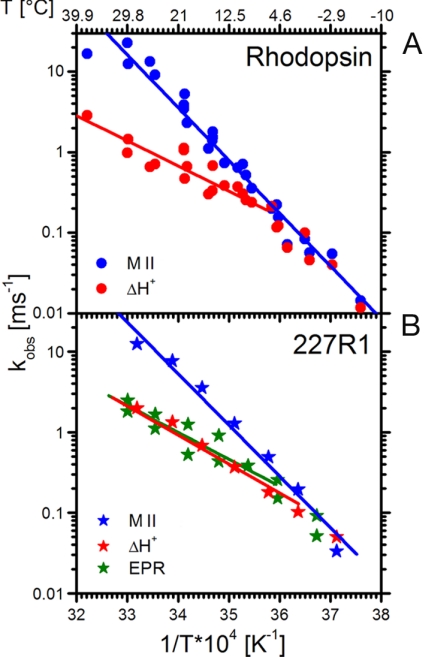
Fig. 4.
Arrhenius plots of the rate constants for MII formation, proton uptake, and TM6 motion. (A) WT rhodopsin in DM. MII formation (blue dots) and proton uptake (red dots) were measured by 380-nm and 595-nm absorbance changes, respectively. (B) The same data for rhodopsin 227R1 in DM, including rate data from EPR measurements that reflect TM6 movement (green stars). Estimates in the errors involved in the EPR measurements are provided by the differences in duplicate measurements made for most temperatures.

