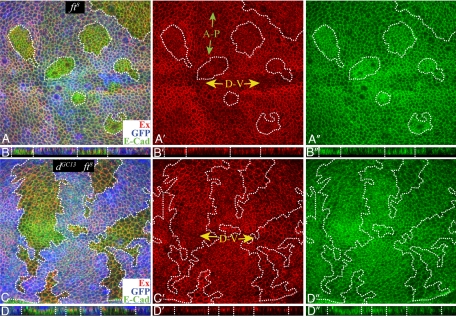
Fig. 3.
Influence of Fat signaling on Ex. Shown are wing imaginal discs stained for Ex (red) and E-cadherin (green). (A and C) Projections through horizontal sections. (B and D) Vertical sections. A′–D′ and A″–D″ show individual channels of the image. Mutant clones (outlined by dashes) were marked by the absence of GFP (blue). GFP staining does not overlap Ex and E-cadherin and is shown from more basal focal planes in the horizontal images. Endogenous Ex staining is lower along the dorsal–ventral boundary (D-V, yellow arrows) and anterior–posterior boundary (A-P, green arrows). (A and B) fat8 mutant clones. Ex staining is decreased. E-cadherin staining sometimes appears increased (20). (C and D) dGC13 fat8 mutant clones. No consistent difference in Ex staining between wild-type and mutant tissue was observed.

