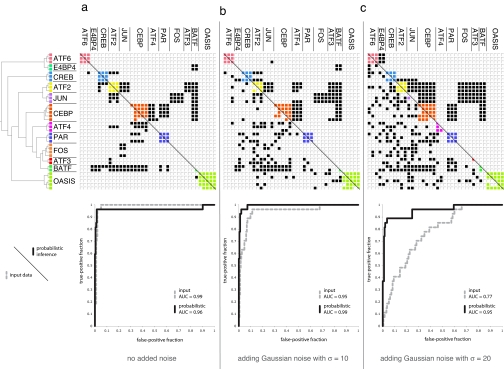
Fig. 4.
Evaluation of the probabilistically inferred human bZIP interactions with various levels of noise applied to the input interaction scores. (a) No noise added. (b) Adding Gaussian noise with a SD of 10. (c) Adding Gaussian noise with a SD of 20. The phylogenetic tree for the human bZIPs is derived from the LZ regions of the bZIP proteins (see Methods). An interaction is represented by a filled cell in the matrix; within-family interactions are colored. (Lower) Input human interaction data. (Upper) Interactions predicted at >50% probability by inference over the full evolutionary model. ROC plots show the quality of each input (dashed gray line) and output (black line) dataset by comparison to a subset of human bZIP pairs with unambiguous experimental interaction data. Interaction matrices were prepared by using TVi (31).

