Fig. 5.
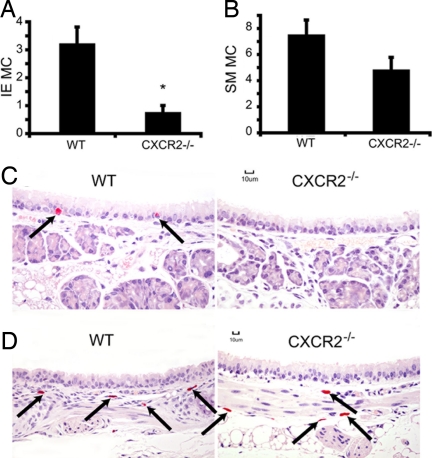
The number of tracheal IE MC is reduced in sensitized, antigen-challenged CXCR2−/− mice. (A) The mean (±SE) number of IE MC per tracheal cross-section in sensitized, antigen-challenged WT and sensitized, antigen-challenged CXCR2−/− mice 1 week after challenge. (B) The mean (±SE) number of submucosal (SM) MC per tracheal cross-section in sensitized, antigen-challenged WT and CXCR2−/− mice 1 week after challenge. The asterisk (*) indicates statistical significance (P < 0.05, n = 9 WT and 10 CXCR2−/−, from two separate experiments) as determined by a two-tailed Student's t test. (C) Representative images of tracheal epithelium demonstrating IE MC (arrows) in sensitized, antigen-challenged WT but not in the sensitized, antigen-challenged CXCR2−/− mice. (D) Representative images of tracheal SM MC (arrows) in sensitized, antigen-challenged WT and sensitized, antigen-challenged CXCR2−/− mice. (Scale bars: 10 μm.)

