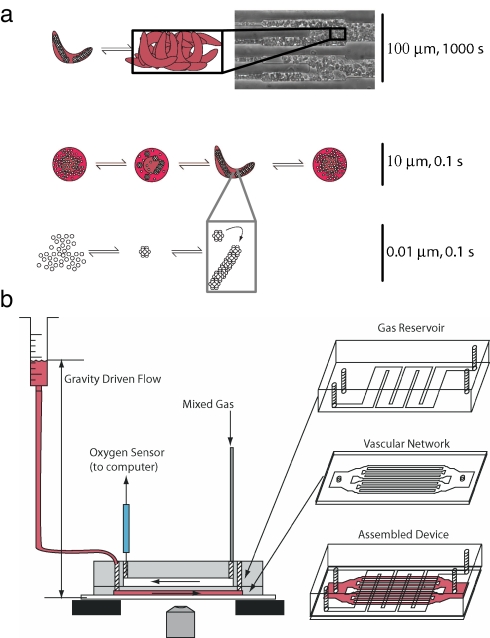
Fig. 1.
Schematic of vasoocclusion and experimental setup. (a) Multiscale schematic of the collective processes of vasoocclusion: polymerization of HbS occurring at the 10-nm length scale, cell sickling at the 10-μm length scale, and vessel jamming at up to 100 μm. The time scales for the different processes range from a fraction of a second for polymerization to a few minutes before a vasoocclusive event: jamming of the artificial vessel by deformed and rigid red blood cells. (b) Fabrication and schematic of the device. The oxygen channels and vascular network were fabricated in separate steps, bonded via oxygen plasma activation, and attached to a glass slide. The widest cross-section in the vascular network on the left and right of the device is 4 mm × 12 μm. The vascular network then bifurcates, maintaining a roughly equal total cross-sectional area. The gas channels were connected to two rotameters regulating the gas mixture that was fed into the device. The outlet of the gas network had an oxygen sensor to validate the oxygen concentration in the microchannels.

