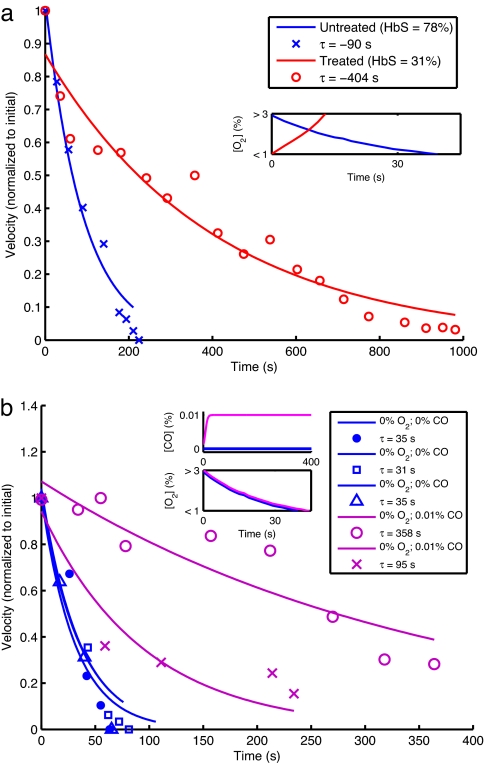
Fig. 4.
Effect of perturbations on occlusion. (a) Velocity profiles for occlusion of a patient blood sample before and after therapeutic red blood cell exchange as measured in a device with a minimal diameter of 30 μm and ambient oxygen concentration that is suddenly reduced to 0%. Velocities are normalized to the maximum within each assay. The blue data points represent the behavior of the patient's sample before treatment (78% HbS). The red data points represent the behavior of a sample obtained after treatment (31% HbS). The lines represent least-squares exponential fits. Note that the velocity of the untreated specimen vanishes after a finite time, whereas that of the treated specimen never vanishes. (Inset) Oxygen concentration profiles as measured during a control experiment detailed in Methods. (b) Velocity profiles for occlusion with and without carbon monoxide. All assays were carried out in a device with a minimal diameter of 15 μm and a patient blood sample with 85.5% HbS. The blue markers correspond to three different occlusion assays with no oxygen or carbon monoxide. The purple markers correspond to assays with 0.01% carbon monoxide and 0% oxygen. (Insets) Gas concentration profiles, with Lower Inset reflecting control measurements detailed in Methods.

