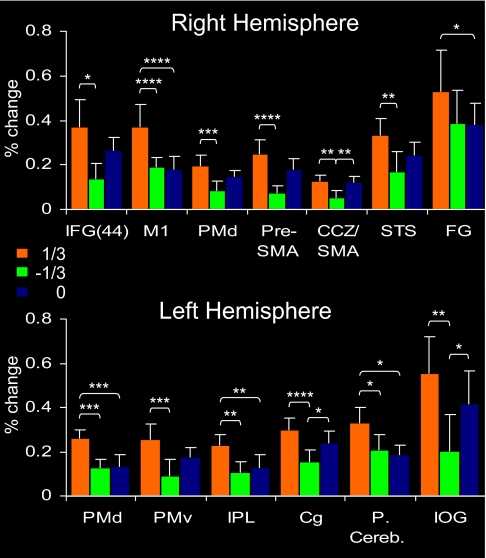
Fig. 2.
Analysis of selected ROIs identified by contrasting the combined activation of all three conditions with rest. Shown are ROIs with stronger activation to the 1/3 condition. Error bars represent SEMs. In the right hemisphere, ROIs included IFG/BA 44 (Talairach coordinates: 49,14,8), M1 (38,−17,49), PMd; (30,−12,43), pre-SMA (6,6,46), STS (61,−40,13), CCZ/SMA (7,−5,49), and fusiform gyrus/BA 18 (24,−82,−23). In the left hemisphere, ROIs included PMd (−22,−17,52), ventral premotor (PMv; −47,−2,26), IPL (−33,−51,35), cingulate gyrus (Cg) (−24,−16,46), posterior cerebellum (−41,−58,−32), and inferior occipital gyrus (IOG; −36,−88,−15). * indicates statistically significant difference at P < 0.05; **, P < 0.01; ***, P < 0.001; ****, P < 0.0001

