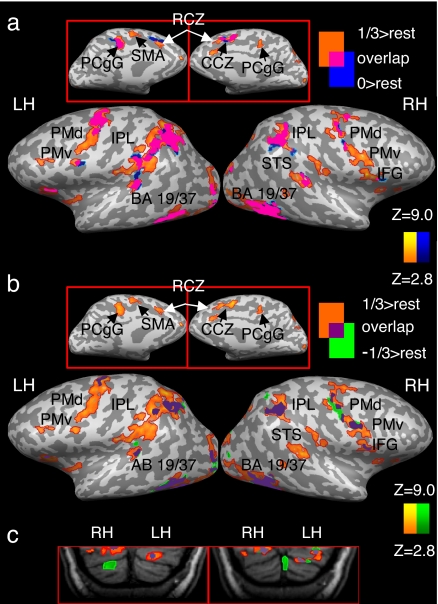
Fig. 3.
Overlapping and nonoverlapping patterns of activation in response to perception of different types of motion. Each condition is compared with rest, and the resulting maps are laid one on top one another. Activation is presented separately for the 1/3 and 0 conditions (a), the 1/3 and −1/3 conditions (b), and in the cerebellum (c). PCgG, posterior cingulate gyrus. All other abbreviations are as in Figs. 1 and 2 and Table 1. Results are corrected for multiple comparisons at the cluster level (P < 0.05).

