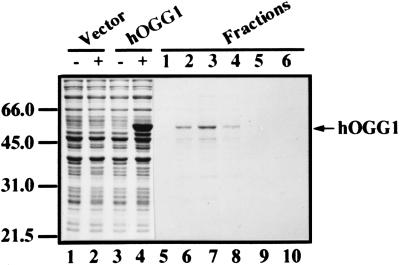
Figure 2.
Purification of recombinant hOGG1 protein. The hOGG1 was overexpressed in E. coli, and proteins were visualized on a 10% SDS/polyacrylamide gel by Coomassie blue staining. Lanes 1–4 show overexpression of the protein at 37°C by IPTG induction and contain whole-cell lysate (5 μl) from bacteria harboring the vector before (lane 1) and after induction (lane 2), or the plasmid carrying hOGG1 cDNA before (lane 3) and after induction (lane 4). Lanes 5–10 show peak fractions (10 μl) eluted with 0.5 M imidazole from a Ni2+-nitrilotriacetic acid column loaded with a crude extract from cells grown at 15°C (see Materials and Methods). The few protein bands migrating below hOGG1 represent degradation or premature termination products of the overexpressed protein, as determined by immunoblotting with the T7⋅Tag Antibody (data not shown). Positions of protein size markers in kDa (Bio-Rad) are indicated on the left.

