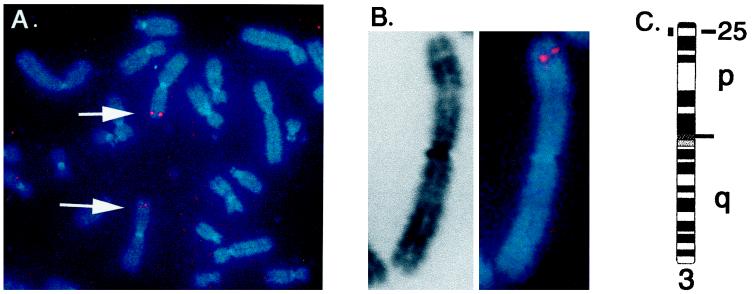
Figure 5.
Fluorescence in situ hybridization mapping of the hOGG1 gene. The hOGG1 cDNA was hybridized to normal human male chromosomes. (A) A chromosome spread from a single cell, showing hybridization to the p arm of each chromosome 3 (arrows). (B) Example of a single chromosome 3 with hybridization signal. Background signals in nonchromosomal areas were suppressed in the electronic image for both A and B. (C) Idiogram of chromosome 3, showing the position of the hOGG1 gene.

