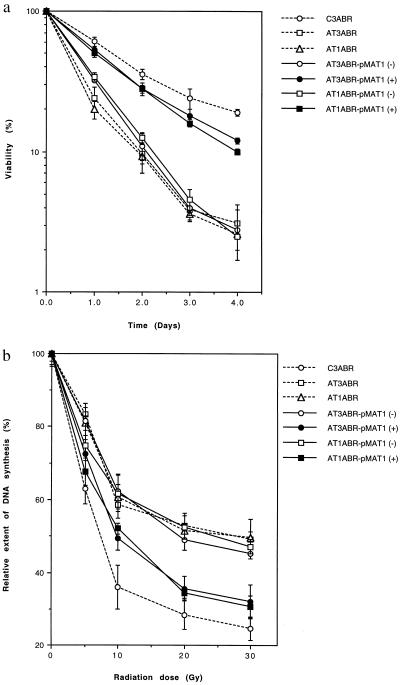
Figure 3.
Correction of the radio-sensitive phenotype in A-T cells. (a) Cell survival. pMAT1 transfected AT1ABR and AT3ABR cells were induced (+) or mock-induced (−) for ATM expression with 5 μM CdCl2 for 16 h. Cell viability was determined as described (4). Nontransfected A-T and normal cells were used as controls. Each point represents an average of triplicate experiments. Bars are SD. (b) Complementation of radio-resistant DNA synthesis in A-T cells after transfection with pMAT1. CdCl2 treated (+) and untreated (−) are shown. Prelabeled cells were induced with CdCl2 for 16 h and irradiated, and DNA synthesis was determined by labeling with [3H]thymidine (0.2 μCi/ml) for 3 h. DNA synthesis is expressed relative to that in unirradiated cells. Points represent mean ratios of thymidine incorporation.

