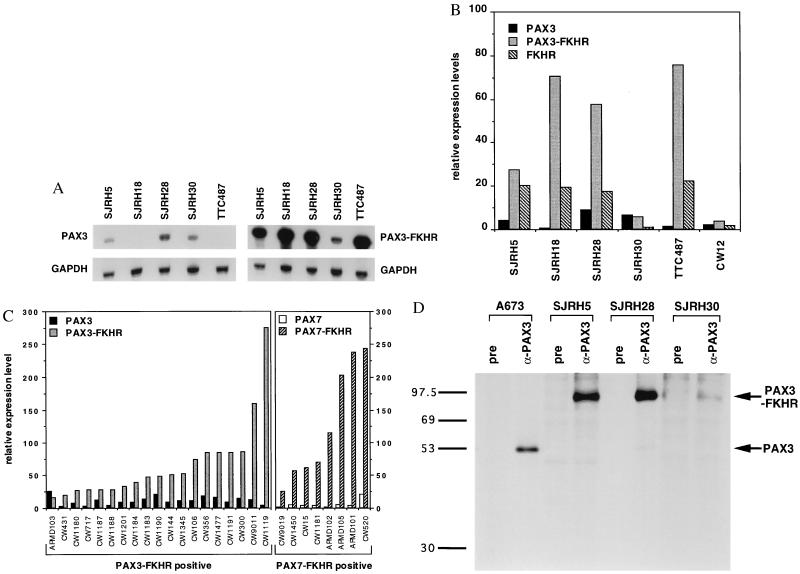
Figure 1.
RNase protection (A-C) and immunoprecipitation (D) analyses of ARMS cell lines and tumor specimens. (A) Total RNA (5–10 μg) from the indicated cell lines was hybridized with the indicated [32P]UTP-labeled test and control riboprobes. Shown are equivalent exposures of the PAX3 and PAX3-FKHR protected fragments (Upper) and the corresponding GAPDH-protected fragments (Lower). (B) Relative expression levels of PAX3, PAX3-FKHR, and FKHR transcripts in six t(2;13)-containing cell lines. RNase protection analysis was performed on the indicated cell lines, the protected bands were quantified using a PhosphorImager and normalized for the number of uridines in each antisense riboprobe, and a test RNA/GAPDH RNA ratio was calculated. Results are shown as expression units relative to PAX3 levels in the embryonal rhabdomyosarcoma cell line RD (arbitrarily set to 10 units). Wild-type and fusion transcripts are indicated as: PAX3, black columns; PAX3-FKHR, stippled column; and FKHR, diagonal columns. (C) Relative expression levels of wild-type and fusion transcripts in PAX3-FKHR-positive (Left) or PAX7-FKHR-positive (Right) tumor specimens. Results are shown as in B. Differences in absolute expression levels among tumors may be partly attributed to variable numbers of nontumor cells within the specimens. Wild-type and fusion transcripts are indicated as: PAX3, black columns; PAX3-FKHR, stippled columns; PAX7, open columns; PAX7-FKHR, diagonal columns. (D) Immunoprecipitation analysis. Lysates from the indicated cell lines were incubated with either anti-PAX3 (α-PAX3) or pre-immune (pre) IgG. Immunoprecipitates were collected and resolved by SDS/PAGE. ARMS cell lines with the t(2;13) are SJRH5, SJRH28, and SJRH30. A673 is a peripheral primitive neuroectodermal tumor cell line lacking the t(2;13). Arrows indicate the PAX3 and PAX3-FKHR proteins. The sizes (in kDa) of protein markers are shown to the left.

