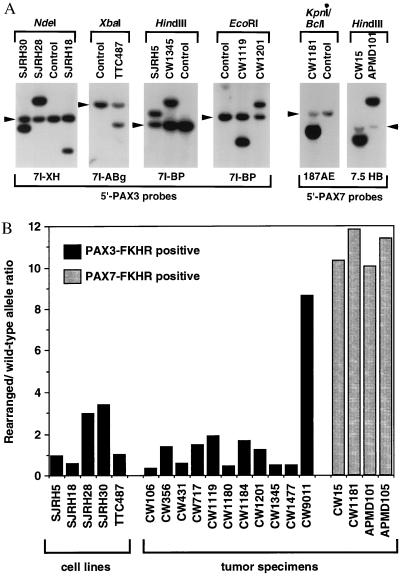
Figure 2.
Quantitative Southern blot analysis of wild-type and rearranged PAX3 and PAX7 alleles. (A) Identification of t(2;13) and t(1;13) rearrangements in cell lines and tumor specimens. The indicated restriction enzymes (above each panel) and hybridization probes (below each panel) were selected to identify the wild-type PAX3 or PAX7 and rearranged PAX3-FKHR or PAX7-FKHR alleles (see Materials and Methods for a description of the probes). The wild-type alleles are indicated by arrowheads. (B) Wild-type and rearranged allele copy numbers. The intensities of the wild-type and rearranged alleles were quantified using a PhosphorImager, and a rearranged to wild-type allele ratio was calculated. The PAX3-FKHR-positive or PAX7-FKHR-positive cell lines and tumors are indicated by black or stippled columns, respectively. Please note that amplification of PAX7-FKHR in case CW15 was not detected in our previous analysis (12); this result can be explained by the presence of additional copies of wild-type FKHR or FKHR-PAX7, which will lower the 3′ to 5′ FKHR signal ratio but will not affect the PAX7-FKHR to PAX7 signal ratio in the current assay.

