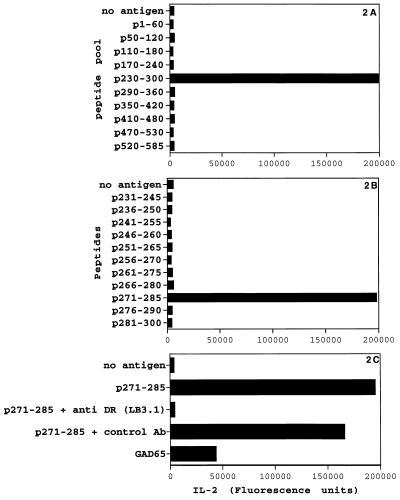
Figure 2.
Representative plot to demonstrate definition of epitope sequence. The analysis for hybridoma 216 is shown. IL-2 production was measured as fluorescence units. Analysis was carried out using DR0401-positive EBV-transformed cells as APCs. (A) Hybridoma 216 responds specifically to a pool containing peptides in the region p230–300. (B) Hybridoma 216 recognizes only p271–285 within that pool. (C) The T cell response is DR0401 restricted as shown by specific blocking of response in the presence anti-HLA-DR antibodies.

