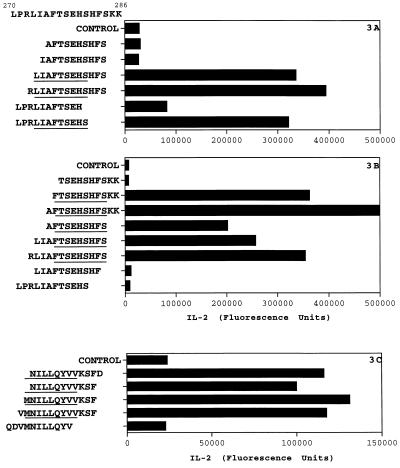
Figure 3.
Representative plots to demonstrate minimization analysis of epitope sequence. The specific epitope regions were mapped utilizing a set of variant peptides. These were designed to truncate the N and C termini of the putative core epitope as shown. The protocol used was as described for Fig. 2. (A) Hybridoma 91 recognizes LIAFTSEHS within p271–285. (B) Hybridoma 63 recognizes FTSEHSHFS within p271–285. (C) Hybridoma 55 recognizes (M)NILLQYVV within p116–130.

