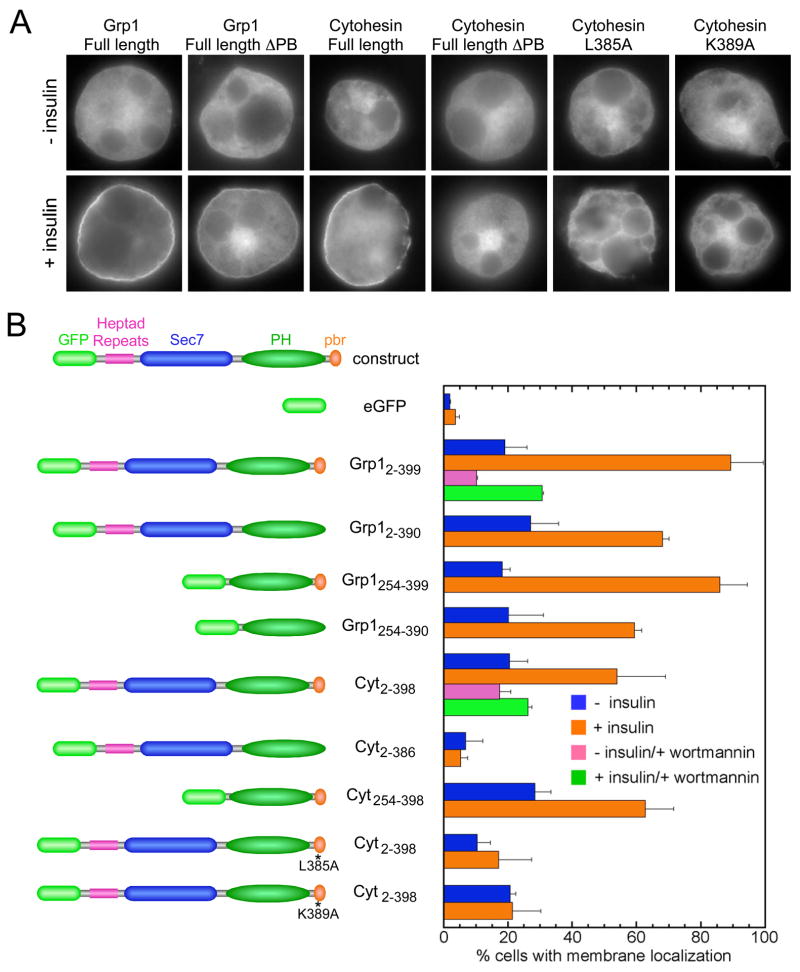
Figure 5. Determinants of plasma membrane targeting in 3T3 L1 adipocytes.
(A) Representative examples of the localization of GFP-fusion constructs in serum starved (−) and insulin stimulated (+) cells.
(B) Percentage of cells for which plasma membrane targeting was observed. Mean values and standard deviations are plotted for 2 independent experiments. Approximately 100 cells were analyzed for each experiment.

