
Figure 2.
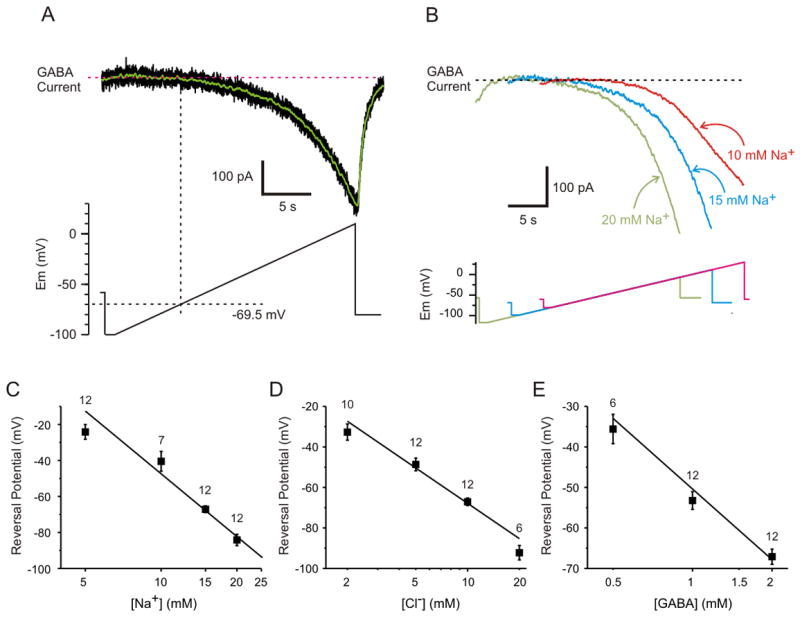
The reversal potential of GAT-1 is near resting potential under physiological conditions, and shifts as predicted for a stoichiometry of 2 Na+: 1 Cl−: 1 GABA. A) Method used to measure the reversal potential of GAT-1. Shown is the current induced in a sniffer cell (top panel, black trace; average of 6 trials) in response to ramp depolarization (bottom panel) of a GAT-1 cell. A moving average (green trace) was calculated from the mean current. A horizontal line was drawn through the flat portion of the trace, and then a vertical line was drawn at the time that the inward current first began to increase. The intersection of the vertical line with the voltage clamp command was used to determine the reversal potential, which was −69.5 mV in this example. B) The reversal potential shifted to hyperpolarized levels when cytosolic [Na+] increased. Shown is the current induced in sniffer cells in response to ramp depolarization of three different GAT-1 cells in which the cytosolic [Na+] ranged from 10 mM to 20 mM. C) Effect of cytosolic [Na+] on reversal potential. D) Effect of cytosolic [Cl−] on reversal potential. E) Effect of cytosolic [GABA] on reversal potential. For C–E the squares are the mean (+/− SEM) of the measured reversal potential, the numbers above each square are the number of cells recorded, and the solid line is the theoretical reversal potential.