Figure 7.

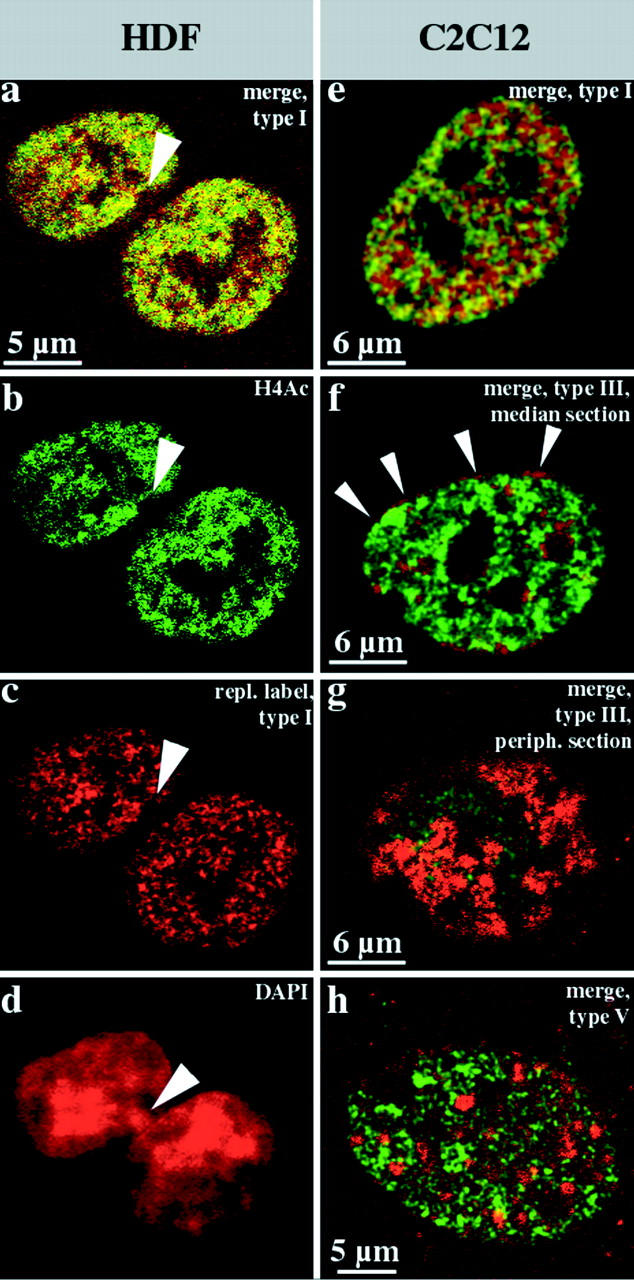
Hyperacetylated isoforms of histone H4 are confined to the interior compartment. Human diploid female fibroblasts (a–d, HDFs) and mouse C2C12 myoblasts (e–h) were replication-labeled with BrdU (TRITC-detected, depicted in red) for 30 min, fixed after 27 h, and immunostained with rabbit antiserum R232/8 specific for hyperacetylated histone H4 (H4Ac, FITC detected, depicted in green). a–c show light optical sections from identical midnuclear planes (b, FITC detection; c, TRITC detection; and a, merge, colocalizing FITC and TRITC signals appear yellow). Hyperacetylated histone H4 (b, FITC-detected, green) is confined to the interior compartment as the early replicating DNA (a and c, type I pattern, red). About 70% of these female HDFs display a strongly DAPI-stained domain at the nuclear periphery (arrowhead in d that is the corresponding epifluorescence DAPI image of the nucleus depicted in a–c). These domains, which likely represent the inactive X chromosome, are not immunostained by R232/8 antiserum and contain no early replicating DNA (a–c, arrowheads). The merges of single light optical sections detecting FITC (hyperacetylated histone H4, green) or TRITC (BrdU replication patterns, red) fluorescence (colocalizing FITC and TRITC signals appear yellow) of identical planes of corresponding C2C12 nuclei are shown in e–h. The nuclei display type I (e), type III (f and g), and type V (h) BrdU labeling patterns (red). Distinct focal planes of the same nucleus are depicted in f (midnuclear plane) and g (nuclear periphery). Note the concentration of R232/8 staining (green) within the interior compartment labeled by the type I pattern (e), whereas the peripheral (f and g) and late replicating (h) compartments are excluded. Note in particular, the absence of FITC fluorescence in the perinuclear region (the red rim around the nucleus in f shown by arrowheads and the red peripheral patches (segregated labeled and unlabeled territories) in g. The faint FITC signal in g is likely due to the low resolution of confocal microscopes along the optical axis.
