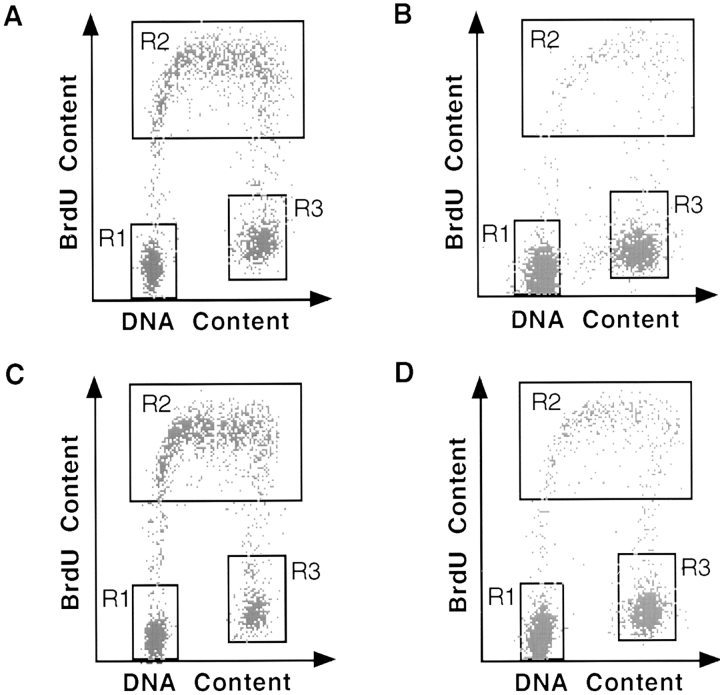
Figure 4.
Cell cycle analysis of EJ-p73α and EJ-p73β cells after induction of p73α or p73β. Cell cycle analysis was performed as described in Materials and Methods. BrdU uptake, as measured by FITC fluorescence, is depicted on the y-axis. DNA content, as measured by propidium iodide fluorescence, is depicted on the x-axis. Populations of cells in different phases of the cell cycle are gated: G0/G1 population (R1), S-phase population (R2), and G2/M population (R3). The percentage of cells in each gate is indicated for each sample in the table. (A) EJ-p73α, (+) tet. (B) EJ-p73α, (−) tet, 3 d. (C) EJ-p73β, (+) tet. (D) EJ-p73β, (−) tet, 3 d.

