
Figure 2.
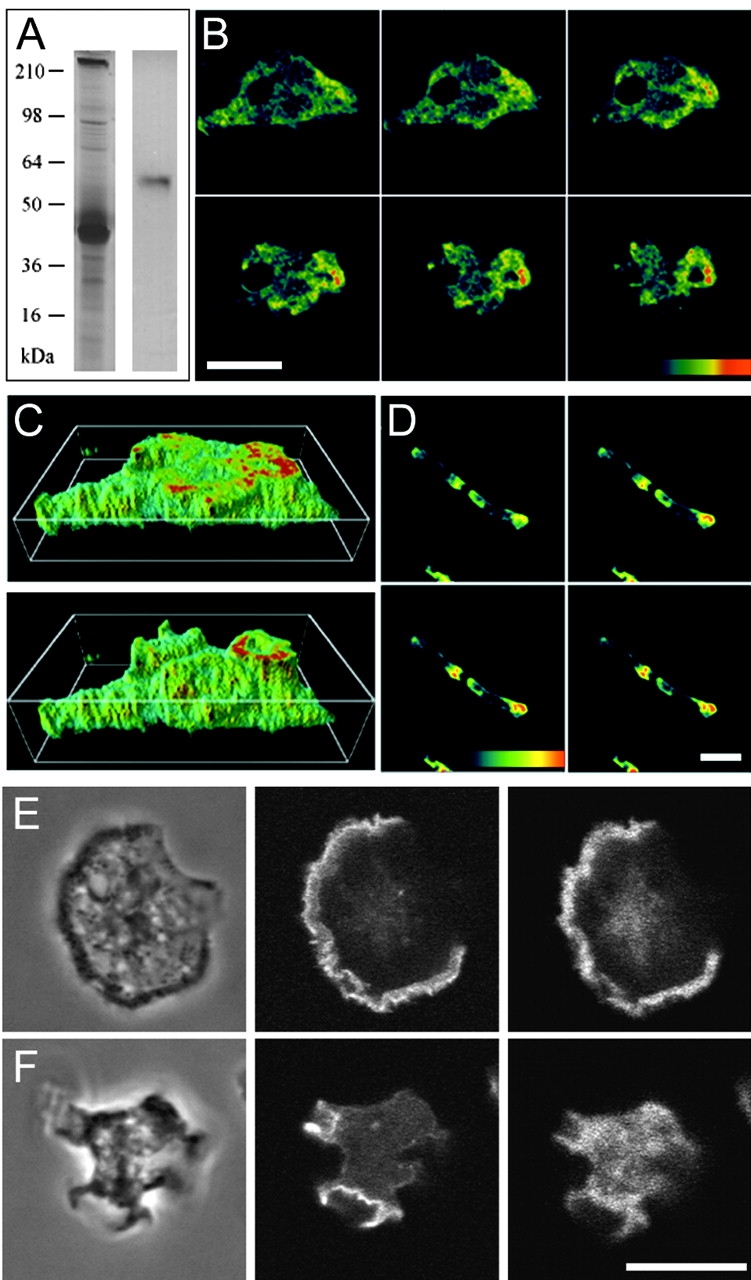
Localization of DAip1 in a purified actin-myosin complex by Western blotting, and in the cell cortex and surface projections of Dictyostelium cells by immunofluorescence. (A) A purified actin-myosin complex was separated by SDS-PAGE and stained with Coomassie blue (left lane), or blotted and probed with DAip1-specific mAb 246-153-2 (right lane). (B) Confocal sections of growth-phase AX2 wild-type cells labeled with DAip1-specific mAb 246-466-6. (C) Three-dimensional image reconstruction from confocal sections shown in B. (D) Confocal sections of aggregation-competent AX2 cells labeled with mAb 246-466-6. The color code represents relative fluorescence intensities as indicated by the colored scales. Distance between sections in B and D is 0.5 μm. (E and F) Confocal sections of two growth-phase AX2 cells double-labeled with DAip1-specific mAb 246-153-2 (right) and TRITC-phalloidin (middle) to visualize F-actin. Typical for the immunofluorescence labeling of DAip1 is the diffuse cytoplasmic distribution reflecting the presence of a cytoplasmic pool of the protein. Phase-contrast images are shown on the left. Bars, 10 μm.