
Figure 5.
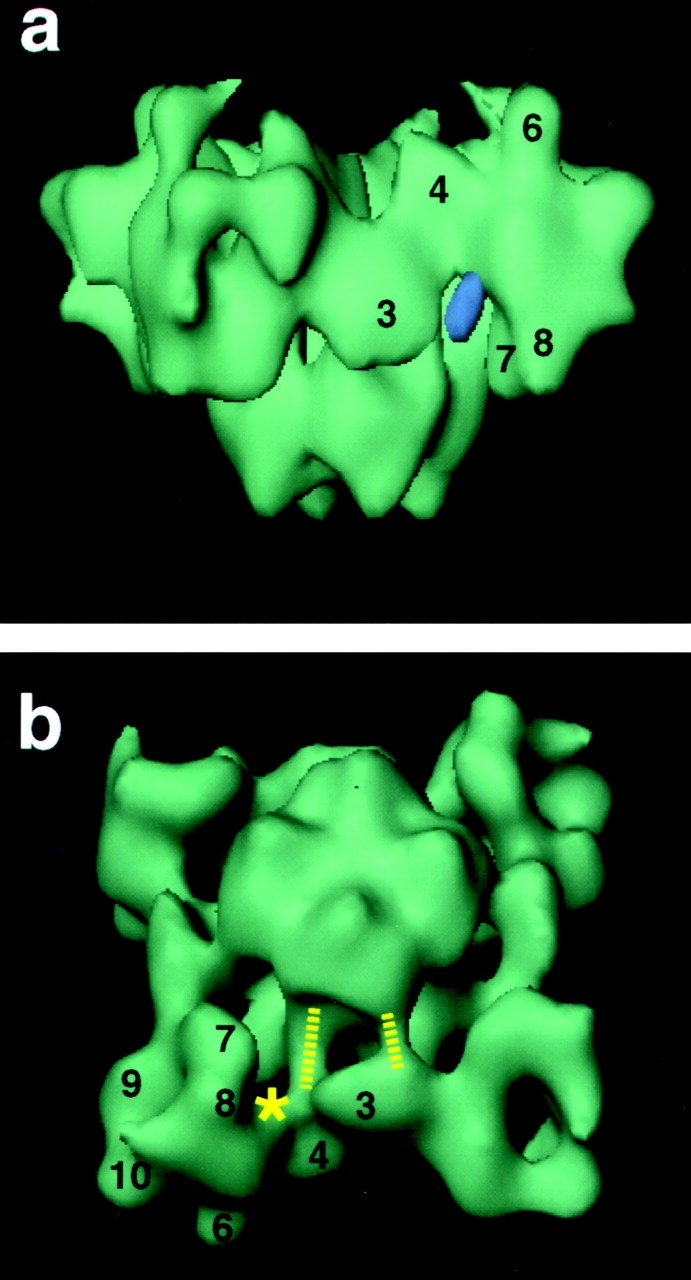
3D reconstructions of the control RyR1 displayed in different orientations to illustrate specific features. (a) Likely site of attachment of IpTxa to RyR1. The difference map was displayed at a higher threshold (in violet) to determine the region of higher rigidity. This region remains connected to the RyR1 structure at one location, suggesting that this is the attachment site. (b) The dashed lines indicate bridges of mass connecting domain 3 and the transmembrane assembly. The asterisk indicates the likely site of attachment of IpTxa.