Figure 1.
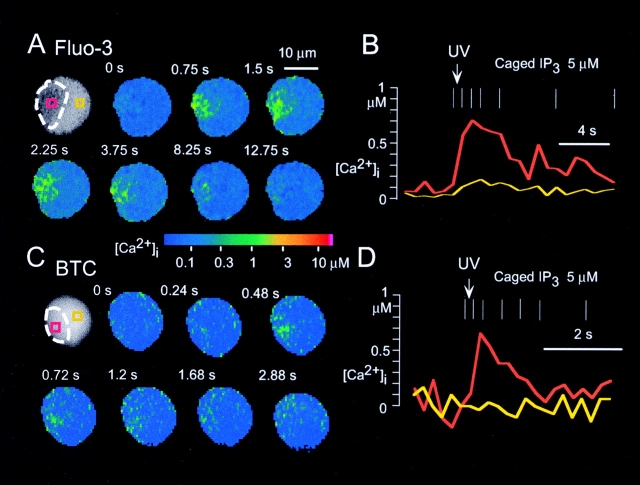
Local Ca2+ spikes induced by photolysis of caged IP3 in pancreatic acinar cells. Local increases in [Ca2+]i were induced by photolysis of 5 μM caged IP3. (A) Ca2+ images obtained with a confocal microscope and the high-affinity Ca2+ indicator fluo-3. (B) Time courses of [Ca2+]i within the rectangles shown in A. (C) Ca2+ images obtained with a cooled CCD camera and the low-affinity Ca2+ indicator BTC. (D) Time courses of [Ca2+]i within the rectangles shown in C. Dashed white lines in the black and white photographs shown in A and C indicate the secretory granule region of the cell. Vertical white bars in B and D indicate the times when the images shown in A and C were obtained; the arrow indicates the time of photolysis of caged IP3 induced by ultraviolet (UV) irradiation.

