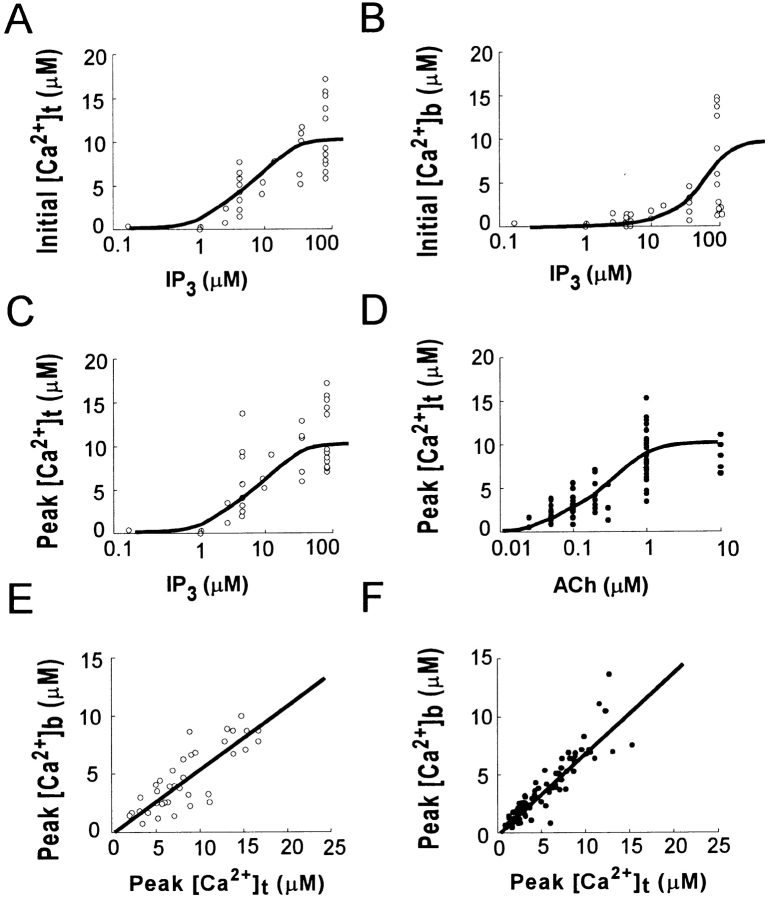
Figure 4.
Dose dependence of amplitudes of global Ca2+ spikes induced by caged IP3 or ACh. (A and B) Semilog plots of [Ca2+]i immediately (0.24 s) after photolysis of caged IP3 in the trigger zone ([Ca2+]t) (A) and in the basal area ([Ca2+]b) (B), respectively. The smooth curves were drawn assuming median effective concentrations of 5 and 50 μM, respectively. (C and D) Semilog plots of peak [Ca2+]i in the trigger zone ([Ca2+]t) versus [IP3]i (C) or ACh concentration (D). The smooth curves were drawn assuming median effective concentrations of 10 and 0.5 μM for IP3 and ACh, respectively. (E and F) Correlations between peak [Ca2+]i in the trigger zone ([Ca2+]t) and that in the basal area ([Ca2+]b) for global Ca2+ spikes induced by IP3 or ACh, respectively. The regression coefficients are 0.57 and 0.63 for IP3 and ACh, respectively.

