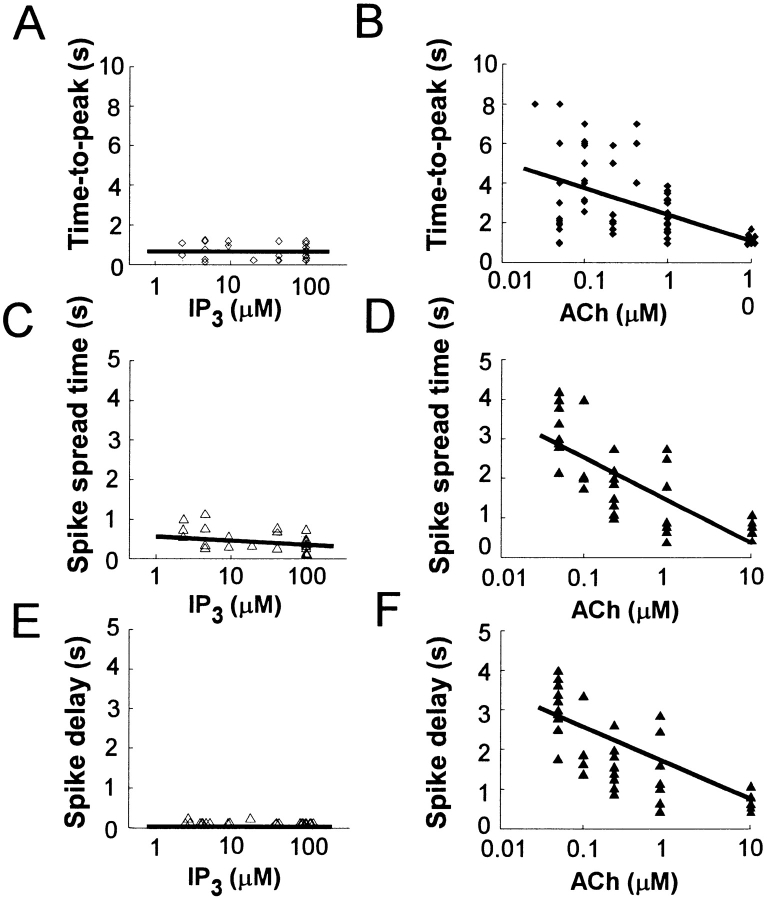
Figure 5.
Dose dependence of time courses of global Ca2+ spikes induced by caged IP3 or ACh. (A and B) Semilog plots of the time-to-peak of Ca2+ spikes in the trigger zone versus concentration of IP3 (A) or ACh (B). (C and D) Semilog plots of spike spread time versus concentration of IP3 (C) or ACh (D). (E and F) Semilog plots of spike delay time versus concentration of IP3 (E) or ACh (F). Correlation coefficients are 0.066 (P > 0.1), 0.45 (P < 0.001), 0.29 (P > 0.1), 0.63 (P < 0.001), 0.003 (P > 0.1), and 0.61 (P < 0.001) for A through F, respectively.

