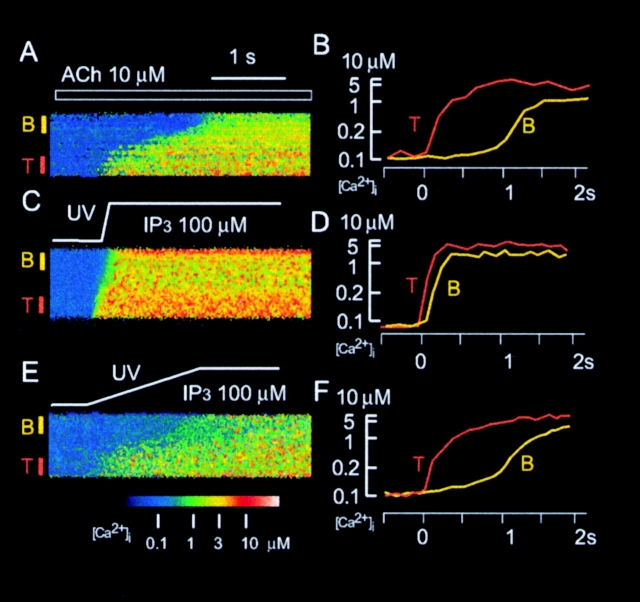
Figure 6.
Line-scan analysis of global Ca2+ spikes induced by ACh or caged IP3. (A, C, and E) Increases in [Ca2+]i recorded with the line-scan mode of the confocal microscope and with fluo-3 as the Ca2+ indicator. The trigger zone and basal area of the acinar cells are denoted by T and B, respectively. The cells were stimulated either with 10 μM ACh (A), or by rapid (C) or slow (E) photolysis (indicated by tracings above images) of 100 μM caged IP3. (B, D, and F) Time courses of [Ca2+]i in the trigger zones and basal areas for the cells shown in A, C, and E, respectively.

