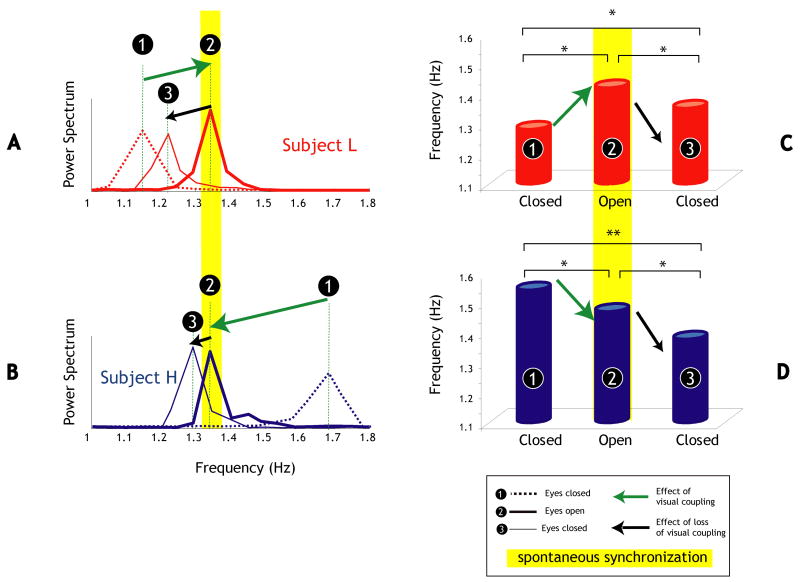
Figure 4. Directionality effect in peak frequency changes in the C-O-C condition.
Power spectrum of the movement of the participant with (A) the lowest (L) initial preferred frequency (red) and (B) the highest (H) initial preferred frequency (blue) for each of the three time segments. For both participants, the effects of opening and closing the eyes is illustrated by green and black arrows respectively. (C–D) Grand average of the peak frequencies for each kind of participant (L & H) in each time segment. T-test significance: * p < .05, ** p < .01.

