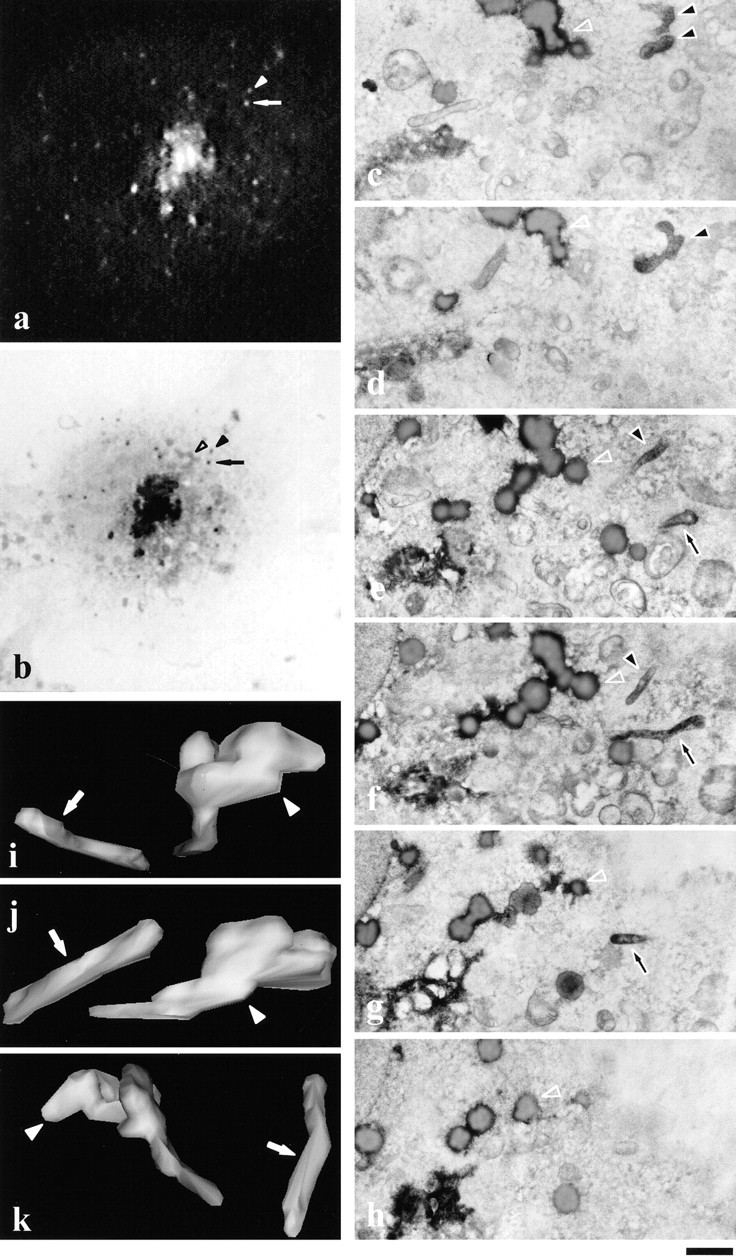
Figure 3.

Dynamics and ultrastructure of individual GPCs as determined by correlative light-EM after release from a 20°C block. A VSVG–GFP-expressing COS-7 cell growing on a CELLocate coverslip was observed after 20–32°C shift in vivo using time-lapse confocal microscopy (movie 3.1; a, arrow and arrowhead). Towards the end of the observation period, the cell was fixed and processed for immunoperoxidase labeling. Two GPCs (b, arrow and arrowhead) were identified as the fluorescent GPCs shown in a on the basis of their coordinates. The general pattern of peroxidase labeling coincided with the fluorescence pattern of VSVG–GFP (compare a and b). To confirm this, the inverted fluorescent image of VSVG–GFP-containing GPCs was overlaid on conventional light images to use intracellular structures (open arrowhead in b, apparently an aggregate of osmiophilic lipid droplets; see also c–h) as reference points in the identification of the GPCs. c–h represent consecutive serial 200-nm sections performed almost tangentially to the basal surface of the cell. Both GPCs (filled arrowhead and filled arrow) were identified in serial sections on the basis of VSVG–GFP labeling and their position relative to the aggregate of lipid droplets (b–h, open arrowhead). 3D reconstruction displayed one GPC as a long tubule (i–k, arrow), whereas the other GPC consisted of globular head and tubular tail (i–k, arrowhead). Bar: (a–c) 10 μm; (c–h) 400 nm; and (i–k) 800 nm.
