Figure 5.

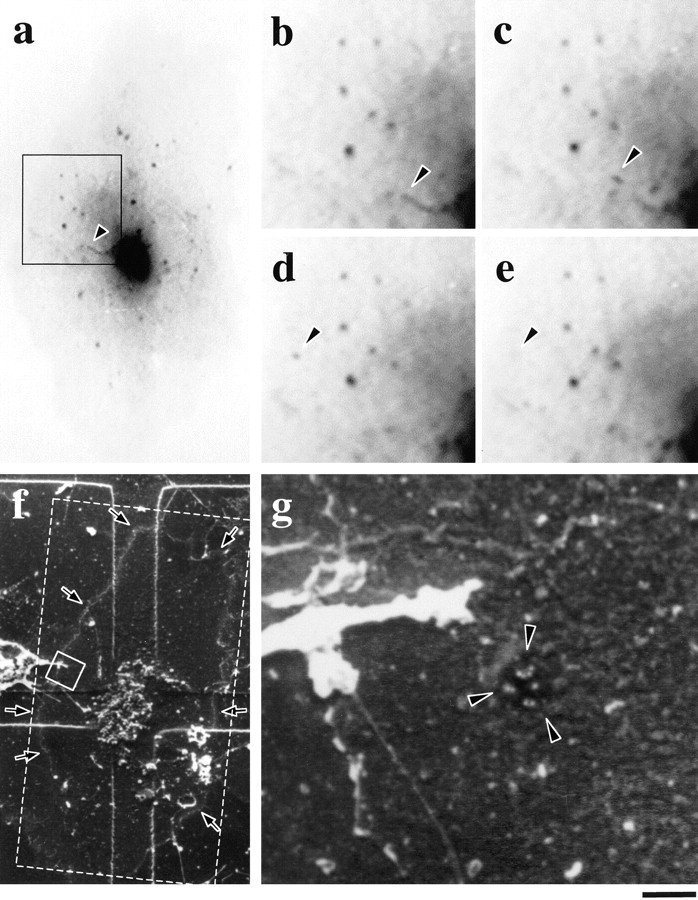
Visualization of a GPC fusion site using scanning EM. Formation, movement, and fusion of GPC (a–e, arrowheads; movie 7.1) was observed under the confocal microscope within a small region (a, black rectangle) of a VSVG–GFP transfected cell. The cell was fixed exactly at the moment of GPC fusion with the PM. The cell surface was then labeled without permeabilization using antibodies against the VSVG ectodomain, and subsequently with protein A conjugated with 30 nm gold, and prepared for scanning EM. The same cell (f, arrows) was identified on the CELLocate grid (the total area shown in a is displayed by the dashed line). g shows the area (indicated by the small white rectangle in f) where GPC fusion occurred. The patch of gold particles lying within the flattened invagination of the cell surface (g, arrowheads) is the GPC fusion site indicated in e (arrowheads). Bar: (a) 9.2 μm; (b–e) 4.2 μm; (f) 10.4 μm; and (g) 410 nm.
