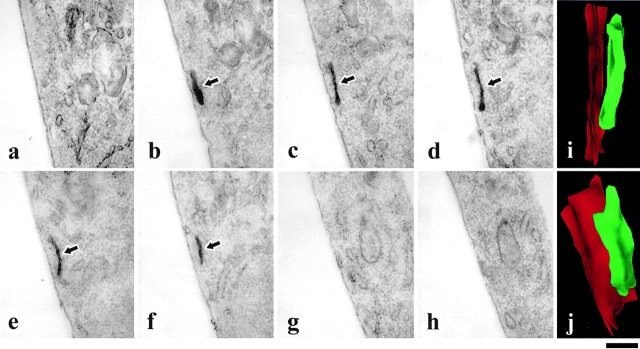
Figure 7.
3D reconstruction of GPCs. Cells were treated as in Fig. 4. VSVG-labeled structures in 50-nm serial sections were photographed and digitized for 3D reconstruction. a–h show eight consecutive serial sections of the GPC of interest. i and j depict the surface of the GPC (green) and its relationship to the PM (red) at two different angles. Although in each single section the GPC appeared as a tubule (arrows), 3D reconstruction revealed the GPC as a flattened sacculus positioned parallel to the PM. Bar: (a–h) 500 nm; and (i–j) 200 nm.

