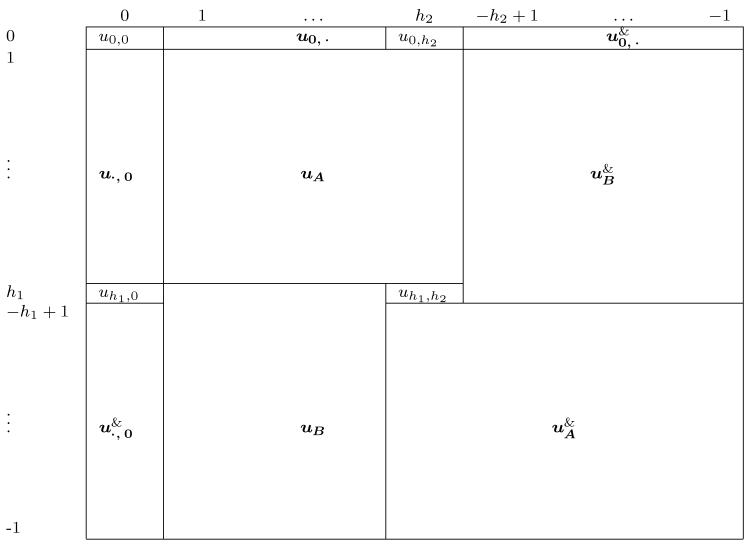
Table 4.
Visual display of the spectral coefficients for a two-dimensional process. The frequencies in each dimension are indicated by the row and column labels, with for d = 1, 2. The & operation indicates that one takes the matrix or vector, flips it in both the horizontal and vertical directions (just the horizontal or vertical in the case of a vector) and then takes the complex conjugates of the elements.
 |
