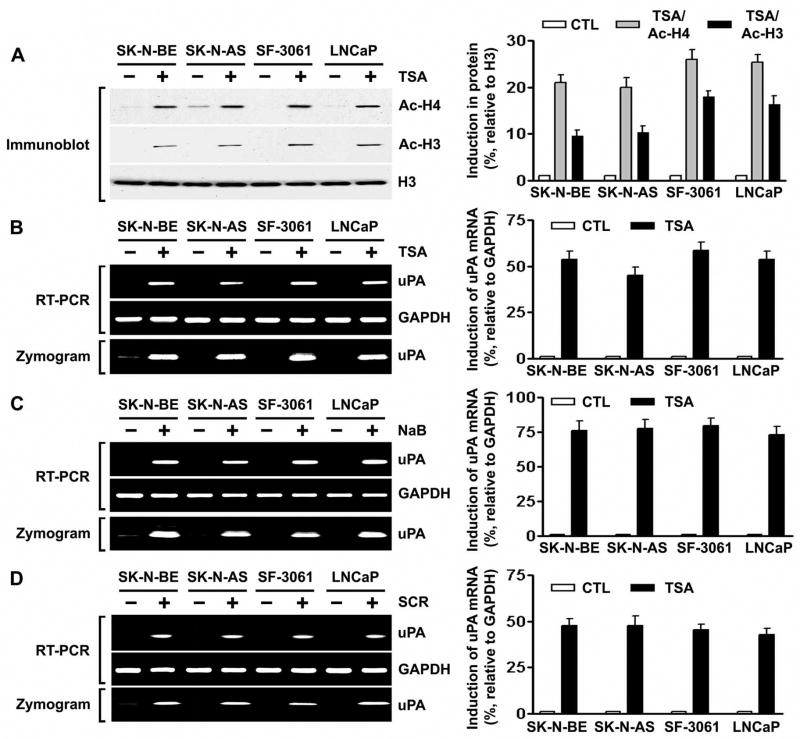
Figure 1. Inhibition of HDAC activity induces the acetylation of histones and concomitant uPA expression in human cancer cells.
A. Left, nuclear extracts were isolated from control and TSA-treated SK-N-BE, SK-N-AS, SF-3061 and LNCaP cells, and immunoblot analysis was performed using anti-acetyl histone H3, anti-acetyl histone H4, and histone H3 antibodies. Histone H3 was utilized as a loading control. Right, densitometric analysis of immunoblots. Data are normalized to H3, averaged and expressed as percent of control (CTL=1).
B. Left, uPA mRNA expression (top) and activity levels (bottom) in control and TSA-treated SK-N-BE, SK-N-AS, SF-3061 and LNCaP cells were analyzed by RT-PCR and fibrin zymography, respectively. Right, densitometric analysis of RT-PCR gels. Data are normalized to GAPDH, averaged and expressed as percent of control (CTL=1).
C. Left, uPA mRNA expression (top) and activity levels (bottom) in control and NaB-treated SK-N-BE, SK-N-AS, SF-3061 and LNCaP cells were analyzed by RT-PCR and fibrin zymography, respectively. Right, densitometric analysis of RT-PCR gels as described in (B).
D. Left, uPA mRNA expression (top) and activity levels (bottom) in control and SCR-treated SK-N-BE, SK-N-AS, SF-3061 and LNCaP cells were analyzed by RT-PCR and fibrin zymography, respectively. Right, densitometric analysis of RT-PCR gels as described in (B).
(All results are representative of three separate experiments.)

