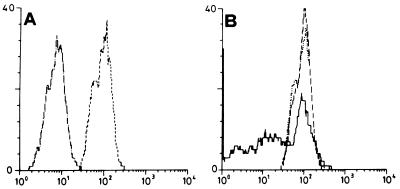
Figure 5.
BCL-2 protein levels in K422 cells exposed for 3 days to 10 μM phosphodiester ODN h1. Flow cytometry histograms of untreated cells labeled with an irrelevant mouse immunoglobulin (-·-·-) or with a BCL-2 mAb (- - -) (A) or of cells treated with sense (—), antisense (· · ·), or inverted (- - -) h1 ODNs (B) are shown.

