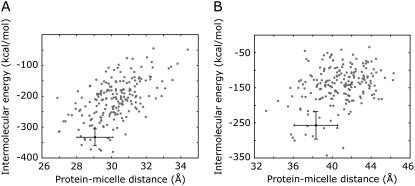
FIGURE 3.
Intermolecular energies of the FYVE-DPC and PX-DPC complexes. Plot of the intermolecular energies as a function of the distances between protein and micelle centers for (A) FYVE-DPC and (B) PX-DPC complexes. The solid circle and bars represent the average values and the corresponding standard deviations of the energetically best 20 structures.

