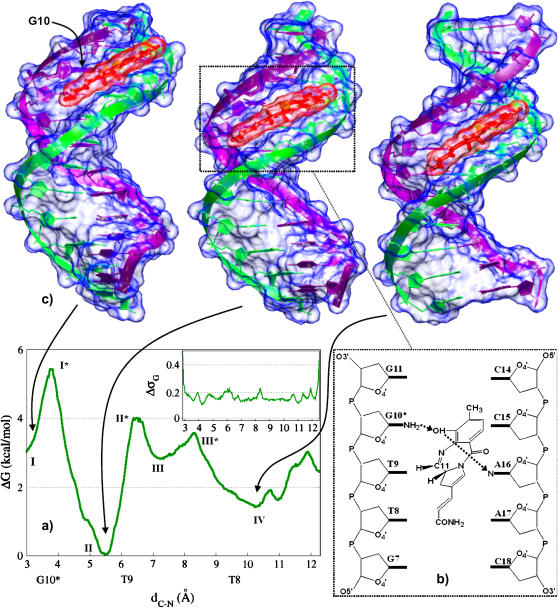
FIGURE 1.
(a) PMF associated to IMI sliding along the DNA minor groove. Standard deviation is reported in the inset. (b) Schematic view of the complex in the configuration corresponding to the free energy minimum. (c) Structures of three relevant conformations of the drug/DNA complex. The second and third structures (from the left) were rotated respectively by ∼30° and ∼100° about the helical axis to center the drug for visualization. Molecular surfaces of drug and DNA are depicted in transparent red and blue, respectively. Figures created with the program VMD (76).

