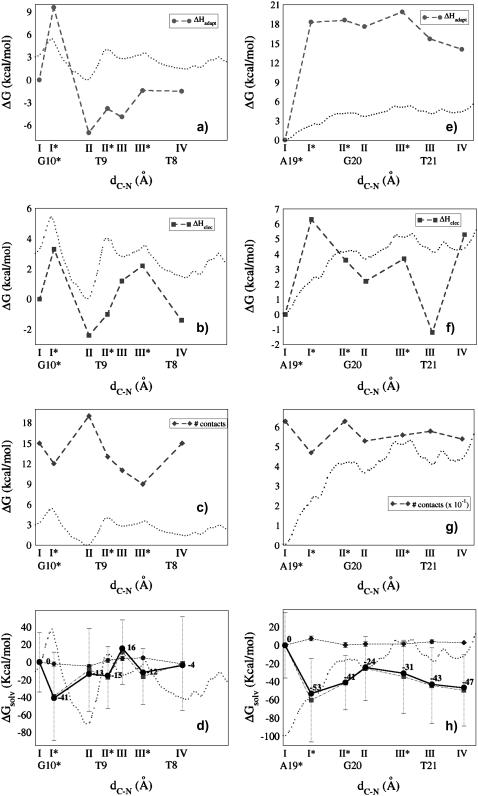
FIGURE 3.
Selected values of (a and e) ΔHadapt; (b and f) ΔHelec; (c and g) number of hydrophobic contacts; (d and h) electrostatic (squares, dotted-dashed line), hydrophobic (rhombus, dashed line), and total (circles, solid line) ΔGsolv along the reaction coordinate d[C-N], compared to the PMF (dotted line, and rescaled in (c, d, g, and h) to allow for an easier comparison with ΔGsolv profiles). Data on the left (a–d) refer to IMI·DNA, those on the right (e–h) to DSI·DNA. Solvation free energies were obtained using the method of Luo and co-workers. For a comparison with data obtained using PARSE radii, see Supplementary Fig. S3.

