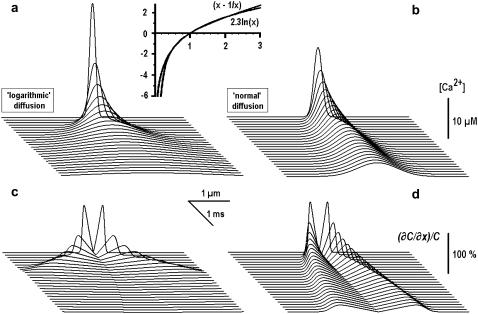
FIGURE 1.
“Logarithmic” and “normal” diffusion of Ca2+ from the point source. Shown are the time-dependent profiles of Ca2+ concentration, which were obtained from Eqs. 8 and 7, describing the fast (a) and the normal (b) diffusion, respectively. In both cases, the effective diffusion coefficient was 40 μm2/s and the same amplitude of point source was used. The inset (top) shows the approximation of “total [Ca2+]” term in Eqs. 4 and 5 by logarithm. Panels a and b depict [Ca2+] changes, and panels c and d present normalized spatial derivatives as indicators of the fronts of Ca2+ concentration.

